Abstract
This study leverages machine learning techniques to predict returns for various asset classes in 2025. By utilizing historical financial and macroeconomic data, we employ Random Forest and XGBoost models to forecast asset performance, including equities, bonds, real estate, and alternative investments. The S&P 500 and US small-cap stocks emerged as the winners in the equities category, showing strong growth potential, with returns ranging from 10.60% to 20.35%. Additionally, Gold performed exceptionally well in the alternative investments category, with a strong outlook and expected returns between 13.06% and 16.46%, highlighting its value as a hedge against market volatility and geopolitical risks. Private equity return data were not available for inclusion in the model, and as a result, these returns were excluded from the predictions. However, we believe that incorporating private equity returns would add additional layers of value to the alternative investments category, potentially enhancing the overall forecast for this asset class.
Overall, equities (S&P 500, small-cap stocks, and the MSCI Global Equity Index) and gold were the standout performers, with Random Forest providing the most robust insights into their expected performance. These findings offer actionable guidance for investors seeking to capitalize on growth while navigating a potentially volatile market environment.
1. Introduction The investment landscape in 2025 is marked by elevated equity valuations, heightened economic uncertainties, and shifting market dynamics. Traditional strategies are being tested as indicators such as record-high levels of the Buffett Indicator and a near-zero Equity Risk Premium (ERP) suggest potential overvaluation in equity markets. For a deeper exploration, see the article: Strategic Response to Uncertainty in 2025.
To address these challenges and provide clarity in navigating the current market environment, this study leverages advanced machine learning models, including Random Forest and XGBoost. These models are employed to predict returns across key asset classes—equities, bonds, and other forms of alternative investments—offering data-driven insights to identify opportunities and mitigate risks in 2025.
2. Methodology
2.1 Data Collection and Preprocessing The dataset spans multiple decades, capturing annual returns and macroeconomic indicators. Key features include:
- Total US Market Cap/GDP
- Inflation Rate
- Federal Funds Rate
- Annual Yield on 2-Year Treasury Notes
- S&P 500 P/E Ratio
For 2025, the model’s predictions are based on the following key economic and market metrics:
- Total US Market Cap to GDP: 203.3%
- Inflation Rate: 2.3%
- Federal Reserve Rate: 4.00%
- Annual Yield (2-Year Treasury): 4.259%
- S&P 500 P/E Ratio: 30.63
These values reflect expectations of elevated equity valuations, moderate inflation, and stable yields, which were critical in guiding the predictive framework for asset returns.
The target variables consist of percentage returns for the aforementioned asset classes. Feature engineering introduced new variables, such as interaction terms (e.g., Inflation × Fed Rate) and rolling averages (e.g., 3-year rolling mean of inflation). To prepare the data for modeling, features were scaled using StandardScaler. Data from 2010 to 2016 was reserved for validation, while the remaining historical data was used for training. The 2025 data served as the test set.
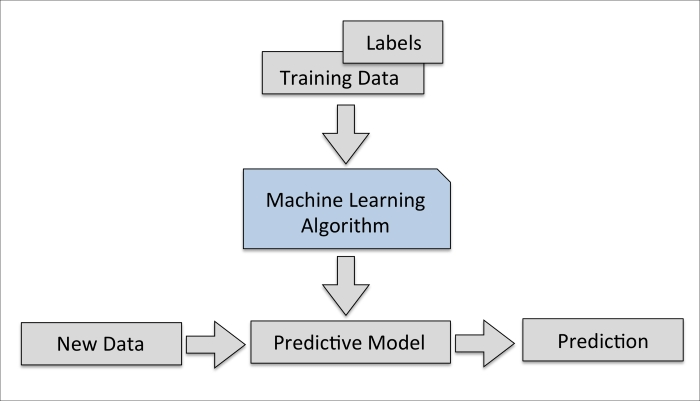
2.2 Machine Learning Models Two machine learning models were implemented:
- Random Forest: An ensemble learning method that constructs multiple decision trees and averages their outputs to enhance accuracy and reduce overfitting. Grid search was employed for hyperparameter tuning.
- XGBoost: A gradient-boosted decision tree model known for its computational efficiency and predictive power. Randomized search was used for hyperparameter optimization.
Both models were evaluated on validation data using MAE and MSE metrics to assess predictive performance.
3. Results
3.1 Model Performance The following validation metrics were obtained from observations spanning 2010 to 2016, split as part of the validation data set.
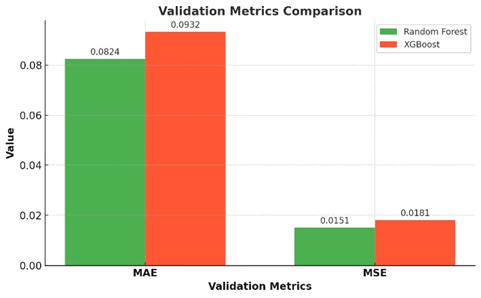
Figure 1: This chart highlights the performance of Random Forest and XGBoost models in terms of Mean Absolute Error (MAE) and Mean Squared Error (MSE). Lower values indicate better performance, with Random Forest slightly outperforming XGBoost in both metrics.
Random Forest outperformed XGBoost in both MAE and MSE, demonstrating greater predictive accuracy and reliability across asset classes.
3.2 Predictions for 2025 Below are the predicted returns for 2025 by two machine learning models: Random Forest and XGBoost. These predictions are expressed as percentages across various categories.
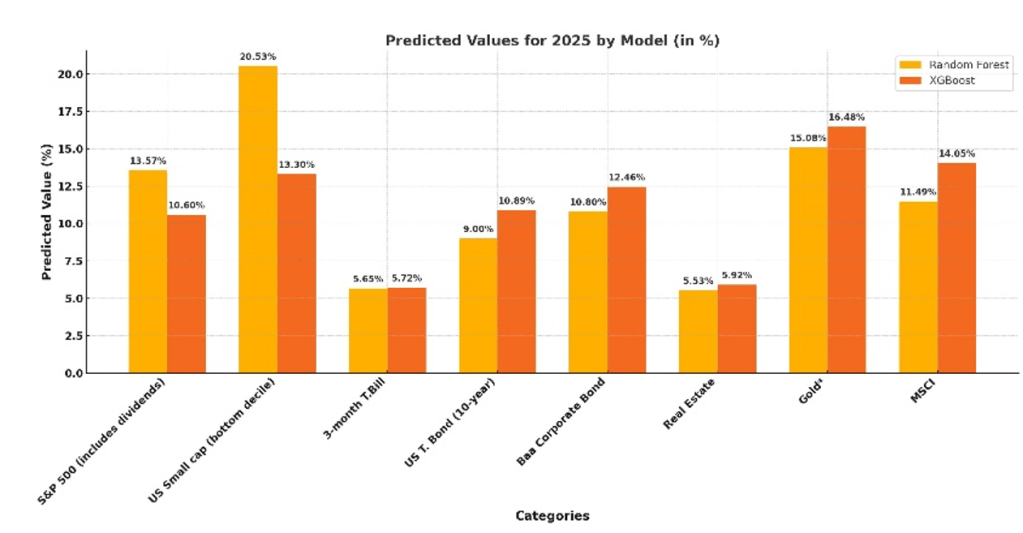
Figure 2: This chart compares the predicted returns (%) for various asset classes in 2025 as forecasted by Random Forest and XGBoost models. The predictions include key categories such as the S&P 500, US Small Cap, Bonds, Real Estate, and Gold, illustrating model-specific differences in performance expectations.
Key Observations: Predicted Asset Class Returns for 2025
- US Small-Cap Stocks (Russell 2000): Predicted to deliver the highest returns, with 20.53% (XGBoost) and 13.30% (Random Forest).
- S&P 500 (Index): Projected returns of 13.57% (Random Forest) and 10.60% (XGBoost) reflect robust growth expectations.
- Gold: Demonstrated strong performance with predicted returns of 16.46% (XGBoost) and 15.08% (Random Forest).
- Real Estate: Modest growth expectations, with returns of 5.92% (XGBoost) and 5.53% (Random Forest).
- 3-Month T-Bill: Predicted to yield modest returns of 5.72% (XGBoost) and 5.65% (Random Forest).
- 10-Year Treasury Bonds: Expected returns of 9.00% (Random Forest) and 8.80% (XGBoost).
- Baa Corporate Bonds: Strong fixed-income performance, with returns of 12.46% (XGBoost) and 10.89% (Random Forest).
- MSCI Global Equity Index: Predicted global equity returns of 14.05% (XGBoost) and 11.49% (Random Forest).
4. Discussion
4.1 Strategic Insights from Model Predictions This study’s machine learning models provide valuable insights into potential market opportunities for 2025. Random Forest, with its superior performance metrics, highlights the growth potential of several asset classes.
Equities
- S&P 500 (Index):
Predicted returns of 13.57% (Random Forest) and 10.60% (XGBoost) align closely with external forecasts of a 10% total return (New York Times; Goldman Sachs). These returns reflect expectations of steady earnings growth, high valuations (P/E ratio: 30.63), and moderate inflation (2.3%). This alignment highlights the reliability of the model in capturing key drivers of large-cap equity performance. - US Small-Cap Stocks (Russell 2000): Predicted returns of 20.53% (XGBoost) and 13.30% (Random Forest) highlight the growth potential of small-cap stocks in 2025. Notably, these predictions align with analyst expectations that small caps are positioned for significant earnings growth in the coming year. According to FactSet consensus estimates, small caps are expected to deliver 22% EPS growth, significantly outpacing the 15% EPS growth projected for large caps (American Century Investments, Global Small Cap 2025). This comparison highlights the credibility of the model’s predictions, particularly the XGBoost result of 20.53%, which closely mirrors the expected earnings growth trajectory of the small-cap sector. The Random Forest prediction of 13.30%, while more conservative, still reflects substantial potential for small-cap outperformance relative to other asset classes.
Alternative Investments
- Gold:
Predicted returns of 16.46% (XGBoost) and 15.08% (Random Forest) align with external analyses suggesting continued demand for gold as a hedge against market volatility (BENZINGA, Gold Price Forecast 2025). With stable inflation and geopolitical uncertainties, gold remains an essential portfolio diversifier for 2025. The model captures its defensive characteristics, especially in periods of uncertainty. - MSCI Global Equity Index:
Predicted returns of 14.05% (XGBoost) and 11.49% (Random Forest) highlight opportunities in global equity and emerging markets.
Fixed Income
- 3-Month T-Bill:
Predicted returns of 5.72% (XGBoost) and 5.65% (Random Forest) align closely with short-term rate expectations, reflecting the Federal Reserve’s policy rate of 4.00%. These modest returns reinforce the T-Bill’s role as a low-risk, liquid investment option. The predicted returns for the 3-month T-bill are 5.72% (XGBoost) and 5.65% (Random Forest), slightly above its current yield of 4.20% (Y-chart, 3-month T bills 2025). - 10-Year Treasury Bonds:
Predicted returns of 9.00% (Random Forest) and 8.80% (XGBoost) significantly exceed external forecasts of 3.5%–5.0% (Morningstar, 2025 Bond Market Outlook).
Explanation of Bias: The higher-than-expected returns likely stem from the model’s overweighting of historical high-yield periods, such as the 1980s, when interest rates were exceptionally high (Federal Reserve History). Adjusting for modern economic conditions, including lower inflation and a more stable yield environment, would bring these predictions closer to market expectations. Despite this, treasuries remain a cornerstone for stability and income generation. - Baa Corporate Bonds:
Predicted returns of 12.46% (XGBoost) and 10.89% (Random Forest) highlight the competitive yields of corporate bonds. However, these results may be biased toward the economic conditions of the 1980s, a period marked by elevated interest rates and high bond yields due to the Federal Reserve’s aggressive monetary tightening during the Great Inflation era.
Real Estate
- Real Estate:
Predicted returns of 5.92% (XGBoost) and 5.53% (Random Forest) indicate subdued growth and real estate continued role as a stable, income-generating investment for long-term portfolios.
These results highlight the reliability of the models for most asset classes while emphasizing the need to refine predictions for long-term bonds. This analysis supports the importance of diversification, with small-cap stocks, gold, and global equities emerging as standout opportunities for 2025.
4.2 Limitations and Future Research While the models performed well, their accuracy depends on the stability of macroeconomic relationships. Future research could:
- Incorporate geopolitical and sector-specific factors for enhanced predictions.
- Explore advanced machine learning techniques, such as deep learning, for further improvements.
- Adapt models dynamically to respond to real-time economic changes.
By addressing these limitations, future studies can enhance the applicability of machine learning models in financial forecasting.
5. Conclusion This study highlights the effectiveness of machine learning models, XGBoost and Random Forest, in predicting financial returns across a range of asset classes for 2025. The findings reveal a clear theme: success in 2025 will require balancing growth opportunities with the stability of more defensive investments in a dynamic market environment.
US small-cap stocks emerged as a strong growth opportunity, reflecting their potential to outperform in 2025. Gold demonstrated its significance as a defensive asset, reinforcing its role as a safeguard against market volatility. The MSCI Global Equity Index further highlighted opportunities in global equity markets, driven by structural economic trends.
Fixed income assets provided a foundation of stability, with short-term Treasury bills and long-term government bonds offering reliable yields. Corporate bonds added a layer of attractive income generation. Real estate offered steady growth and remained a reliable option for long-term income generation.
The results emphasize the importance of combining high-growth opportunities in equities and global markets with the steady performance of fixed income and real estate. A diversified portfolio strategy that incorporates these elements will enable investors to navigate the complexities of 2025, capturing growth while maintaining resilience in the face of uncertainty.
References
- Federal Reserve Economic Data (FRED). (2025). Data for S&P 500, US Small-Cap Stocks, and Gold Prices. Federal Reserve Bank of St. Louis. Retrieved from https://fred.stlouisfed.org.
- Bloomberg. (2025). MSCI Index Data. Retrieved from https://www.bloomberg.com.
- New York Times. (2024, December 31). After Bumper Year, Wall St. Sees More Gains in 2025. Retrieved from https://www.nytimes.com/2024/12/31/business/stock-market-2025-predictions.html.
- Goldman Sachs. (2024, November 26). The S&P 500 is forecast to return 10% in 2025. Retrieved from [https://www.goldmansachs.com].
- Morningstar – 2025 Bond Market Outlook: 10-Year Treasury Yield Forecast (3.5%–5.0%).
https://www.morningstar.com/bonds/2025-bond-market-outlook-yields-range-bound-volatile. - American Century Investments: Global small caps: 2025 trends. Retrieved from https://www.americancentury.com/institutional-investors/insights/global-small-caps-2025-trends/?nocache=true.
- BENZINGA: Gold price prediction for 2025. Retrieved from https://www.benzinga.com/money/gold-price-prediction-2025.
- YCharts: 3-Month T-Bill Yield Data – Retrieved from https://ycharts.com/indicators/3_month_t_bill
- Federal Reserve History – A period of high interest Rates with inflation peaking in 1980s.
https://www.federalreservehistory.org/essays/great-inflation.
