
Abstract
This study identifies the key drivers of asset class returns across various economic periods (1975–2024, 2014–2024, 1995–2000, and 2020–2024) using Random Forest feature importance analysis. By exploring macroeconomic relationships and valuation metrics during distinct market eras, we provide actionable insights for navigating the investment landscape in 2025. Similarities to the dot-com bubble of 1995–2000, marked by speculative excess and elevated equity valuations, emphasize the importance of focusing on value and quality investments– highlighting the relevance of valuation metrics like Total US Market Cap-to-GDP in identifying speculative bubbles and guiding allocation strategies.
To optimize returns in 2025, we recommend prioritizing high-quality equities with strong fundamentals, increasing exposure to inflation-sensitive assets, selectively diversifying into undervalued and/or emerging international markets, and maintaining cautious allocation to small-cap equities. Investments in short-term bonds and Treasury Inflation-Protected Securities (TIPS) remain attractive, while gold and industrial commodities provide effective hedges against inflationary pressures. Real estate investments should focus on industrial properties and multi-family housing. By leveraging historical insights and feature importance analysis, this data-driven framework offers investors a robust foundation for mitigating risks and capturing opportunities in an increasingly complex market environment.
Introduction
Financial markets are influenced by a complex interplay of macroeconomic factors, valuation metrics, and policy decisions. Understanding which factors drive asset class returns is crucial for developing predictive models and informing investment strategies. This study utilizes Random Forest regression to assess feature importance across different market periods, revealing how the significance of economic indicators evolves over time.
We focus on four distinct time periods:
- 1975-2024: A long-term overview capturing structural changes in the global economy.
- 2014-2024: A decade marked by low interest rates, quantitative easing, and rising market valuations.
- 1995-2000 (Dot-com Bubble): A period characterized by speculative overvaluation and rapid technological advancement.
- 2020-2024: The post-pandemic era, defined by inflationary pressures and unprecedented monetary policy interventions.
Methodology
Data and Features
The dataset includes historical data on macroeconomic indicators and financial metrics, such as:
- Annual Yield (2yr Treasury): Reflects short-term interest rate expectations.
- Federal Reserve Rate (Fed Rate): Indicates monetary policy stance.
- Inflation Rate: Measures changes in purchasing power.
- S&P 500 P/E Ratio: Captures market valuation levels.
- Total US Market Cap/GDP: Represents overall market size relative to the economy.
These features were chosen for their established relevance to asset pricing and their ability to capture diverse aspects of economic conditions.
Random Forest Regression
Random Forest regression was used to model asset class returns and evaluate feature importance. This ensemble learning method is well-suited for capturing non-linear relationships and handling complex datasets. Feature importance scores were averaged across asset classes and normalized for comparability.
Heatmap Visualizations
To complement the Random Forest analysis, heatmaps were generated for each time period. These visualizations provide an intuitive representation of feature importance across asset classes, highlighting patterns and trends over time.
Results and Discussion
1. 1975-2024: Long-Term Trends
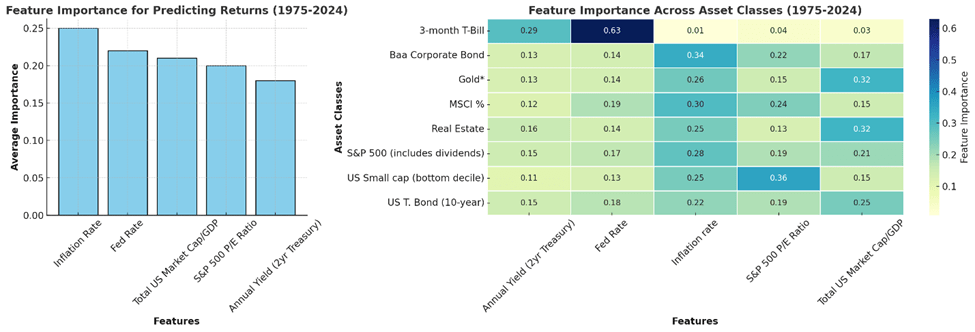
Over the long term, asset class returns were significantly influenced by structural economic changes and monetary policy. Short-term bonds, such as the 3-month T-Bill, were most sensitive to changes in the Federal Reserve Rate, reflecting their dependency on monetary policy adjustments. For equities like the S&P 500 and US Small Cap, the importance of Total US Market Cap to GDP highlights the relationship between market size and economic fundamentals. Real estate returns were moderately impacted by Inflation Rate, as purchasing power erosion affected demand for physical assets. Commodities such as Gold showed a stable correlation with inflation, emphasizing its role as an inflation hedge. Across all asset classes, the Federal Reserve Rate and Inflation Rate consistently shaped returns, highlighting their foundational importance.
2. 1995-2000: The Dot-com Bubble
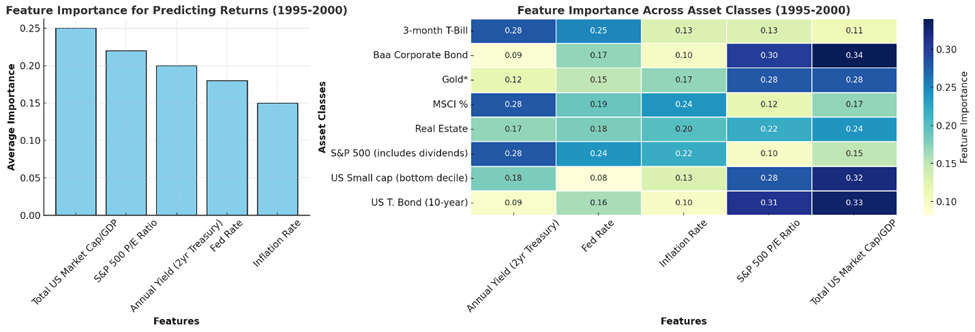
During the dot-com bubble, speculative activity and overvaluation drove asset returns. Equities, particularly the S&P 500 and US Small Cap, were highly influenced by S&P 500 P/E Ratio and Total US Market Cap to GDP, highlighting the speculative exuberance of the era. Real estate returns, while less volatile, reflected speculative capital inflows, as evidenced by the importance of valuation metrics. Returns for commodities like Gold were highly influenced by S&P 500 P/E Ratio and Total US Market Cap to GDP, as the characteristics of the bubble period increased its appeal as a hedge. Most importantly, the increased relevance of the S&P 500 P/E Ratio suggests heightened market sensitivity to overvaluation during this period. Going into 2025 with market valuation at all time high and a potentially bearish outlook based on macro developments, we can learn a lot from this in terms of including gold as a hedge in our asset allocation. For short-term bonds and fixed-income instruments, the Annual Yield on Two-Year Treasury Bonds was a key driver, capturing the influence of monetary policy expectations on yields. The bubble highlighted the vulnerability of equity-driven markets to valuation excesses and the eventual corrections that followed.
3. 2014-2024: The Era of Low Rates and High Valuations
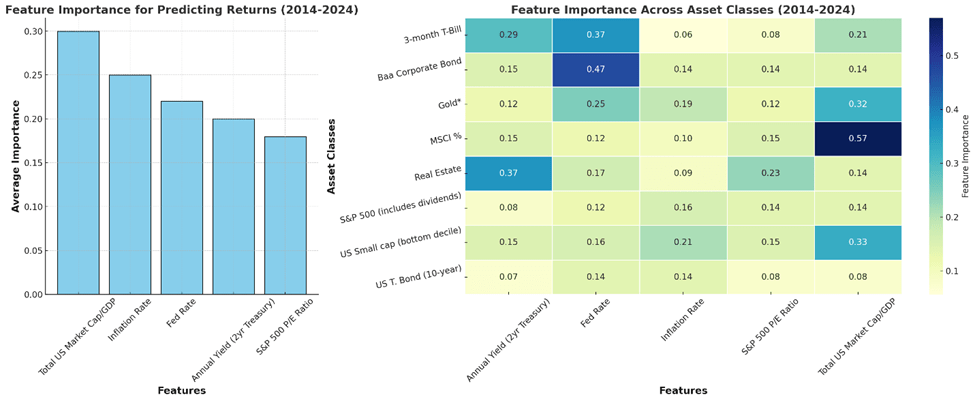
The feature importance analysis for 2014–2024 reveals both continuations of long-term trends and notable shifts. 3-month T-Bills were primarily influenced by the Federal Reserve Rate, consistent with their sensitivity to short-term monetary policy adjustments. Baa Corporate Bonds were also predominantly driven by the Federal Reserve Rate, highlighting the significant impact of monetary policy on corporate borrowing costs.
For S&P 500 equities, no single factor dominated; instead, returns were influenced by a balanced mix of Inflation Rate, Federal Reserve Rate, and valuation metrics like the S&P 500 P/E Ratio. This suggests that, even in a low-stable-rate environment, equity markets responded to a combination of macroeconomic indicators and valuation considerations. U.S. Small Cap equities showed a stronger sensitivity to valuation metrics, particularly the S&P 500 P/E Ratio, indicating that investors placed considerable emphasis on earnings multiples when evaluating smaller companies.
Gold returns were most influenced by the Inflation Rate, keeping its traditional role as an inflation hedge. Real Estate returns were primarily driven by the Annual Yield on 10-Year Treasuries, reflecting the sector’s sensitivity to long-term interest rates and borrowing costs.
International equities (MSCI World ex-U.S.) were significantly impacted by the S&P 500 P/E Ratio, suggesting that U.S. market valuations played a crucial role in influencing global equity returns during this period.
Overall, while the Federal Reserve Rate and Inflation Rate remained foundational across various asset classes, the 2014–2024 period highlighted the growing importance of valuation metrics, particularly the S&P 500 P/E Ratio, in driving asset returns.
4. 2020-2024: Post-Pandemic Recovery
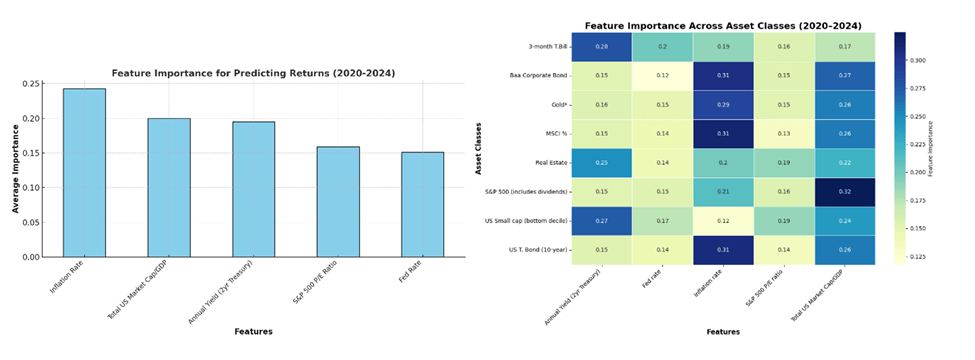
The post-pandemic recovery period saw heightened inflationary pressures and liquidity-driven market behavior. Gold emerged as a critical asset class, with returns strongly tied to the Inflation Rate, reflecting its role as a safeguard against rising prices. Treasury Bonds and Baa Corporate Bonds were also highly sensitive to inflation and monetary policy adjustments, as evidenced by the importance of the Federal Reserve Rate and Annual Yield on Two-Year Treasury Bonds. Equities, including the S&P 500 and US Small Cap, continued to be influenced by Total US Market Cap to GDP, but inflation dynamics introduced additional complexity. Real estate returns were driven by inflation and valuation metrics, highlighting its dual role as both a speculative and inflation-sensitive asset. The interplay of inflation, monetary policy, and market valuations defined this period’s asset performance.
Comparison Across All Periods
A comparative analysis of these periods reveals key commonalities and distinctions in the drivers of asset class returns. Monetary policy indicators, such as the Federal Reserve Rate and Annual Yield on Two-Year Treasury Bonds, consistently influenced fixed-income assets like short-term bonds across all periods. Total US Market Cap to GDP emerged as a unifying metric for equities, reflecting its significance in speculative and valuation-driven markets. Commodities, particularly Gold, maintained their role as an inflation hedge, with heightened relevance during inflationary periods like 2020-2024. Real estate returns exhibited sensitivity to both inflation and valuation metrics, demonstrating its versatility as an asset class. However, the role of Inflation Rate varied significantly, being a minor factor during the dot-com bubble but a dominant driver in the post-pandemic era.
Comparative Lessons for 2025 from Historical Contexts
- Similarities to 1995-2000: Elevated equity valuations mirror the speculative exuberance of the dot-com bubble, necessitating caution and a focus on quality investments.
- Parallels with 2020-2024: Moderate inflation above pre-pandemic level emphasize the importance of inflation-sensitive assets such as Gold and real estate.
Transition from Feature Importance Analysis to Recommendations for 2025
Building upon the feature importance analysis outlined in our study, the recommendations for 2025 align with the observed patterns from historical periods such as 1975-2024, 2014-2024, 1995-2000 (Dot-com Bubble), and 2020-2024. These insights inform the suggested allocation strategies for navigating the unique market conditions of 2025. As of January 2025, the Total U.S. Market Cap/GDP of 208.8% (GuruFocus, 2025), elevated S&P 500 P/E ratio of 30.50 (Multpl), moderate Inflation Rate of slightly above 2% (Comerica), and Federal Reserve Rate of 4.25%-4.50% (AP News) highlight a speculative, valuation-driven environment with inflationary undertones, comparable to the dot-com bubble.
Key Recommendations for Asset Allocation in 2025
- Equities:
- Focus on Quality and Fundamentals: Given the high S&P 500 P/E ratio, prioritize large-cap equities in sectors like healthcare, technology, and consumer staples, which exhibit resilience in speculative environments.
- Diversify Cautiously into Small Caps: While US Small Cap equities offer recovery potential, reduce exposure to highly speculative stocks, drawing from lessons of the dot-com bubble, where overvaluation led to sharp corrections.
- Fixed Income:
- Inflation-Linked Bonds: With moderate inflation, allocate to Treasury Inflation-Protected Securities (TIPS), echoing their relevance during 2020-2024, where inflation-sensitive bonds mitigated risks.
- Short-Term Bonds: 3-month T-Bills remain attractive due to their sensitivity to the Federal Reserve Rate and liquidity benefits, a consistent trend across all analyzed periods.
- Gold and Commodities:
- Gold as a Hedge: Maintain or increase exposure to Gold, leveraging its historical correlation with inflation as seen in 1975-2024 and 2020-2024. Gold’s performance as a safe-haven asset becomes particularly important in speculative or inflationary environments.
- Broaden Commodity Exposure: Diversify into industrial metals and energy commodities, which benefit from global infrastructure spending.
- Real Estate:
- Inflation-Resistant Properties: Focus on industrial properties, multi-family housing, and logistics real estate, which can pass through inflationary costs. This aligns with real estate’s dual role as an inflation hedge and speculative asset, observed in 2020-2024.
- Avoid Overleveraged Assets: High rates environment may pressure valuations, necessitating cautious selection of real estate investments, a lesson reinforced by speculative corrections seen in prior periods.
- Dynamic Allocation:
- Adjust to Macro Trends:
In a market environment shaped by optimism, any development in terms of macro uncertainty and inflation expectations makes staying grounded in company fundamentals critical. Equity valuations are not only a function of projected earnings but are deeply influenced by inflation trends and monetary policy. Investors must therefore monitor macro shifts closely, using inflation and policy signals as a guide to dynamically rebalance portfolios. Increasing allocation to inflation-resistant assets like Gold, commodities, real assets, or uncorrelated source of return is prudent. In times when markets price in only upside, discipline, valuation awareness, and macro vigilance are essential—not just to seize opportunity, but to avoid being blindsided by systemic fragility masked by temporary exuberance.
- Adjust to Macro Trends:
- Risk Management:
- Diversify Holdings: Maintain a balanced portfolio across equities, fixed income, real estate, and commodities to mitigate risks tied to specific macroeconomic conditions.
- Hedge Against Downside Risks: Incorporate protective strategies such as options or alternative investments to safeguard against potential corrections in overvalued markets.
Conclusion
The investment landscape in 2025 requires a balanced, data-driven approach informed by historical insights and current market conditions. By focusing on high-quality equities, inflation-sensitive assets, and dynamic rebalancing strategies, investors can navigate risks while capitalizing on opportunities. Leveraging feature importance analysis ensures a robust, adaptable strategy aligned with evolving economic trends.
Work Cited:
- “USA Ratio of Total Market Cap Over GDP.” GuruFocus, https://www.gurufocus.com/stock-market-valuations.php.
- “S&P 500 P/E Ratio by Year.” Multpl, https://www.multpl.com/s-p-500-pe-ratio/table/by-year.
- “2025 Market Outlook.” Comerica, https://www.comerica.com/insights/wealth-management/2025-Market-Outlook.html.
- “Federal Reserve Interest Rate Update 2024.” AP News, https://apnews.com/article/7474747d890c0fdcc87454fd4c80aaa4.
