
As financial markets evolve in complexity, machine learning techniques have emerged as essential tools for understanding macroeconomic trends and predicting asset performance. This study leverages market regime classification, macroeconomic indicator analysis, and machine learning models to anticipate the investment landscape in 2025. By identifying historical patterns and linking them to current economic conditions, we can make data-driven investment decisions that align with both risk management and opportunity identification.
Methodology
Our approach integrates machine learning techniques and financial analysis to classify market regimes and forecast asset returns. Macroeconomic data and asset return information were sourced from financial databases, focusing on key indicators such as interest rates, inflation, and market valuations due to their historical significance in regime classification. The elbow method was applied to determine the optimal number of market regimes, identifying two distinct clusters: bullish and bearish. A Random Forest model was then trained to classify these regimes and estimate dynamic probabilities for future market conditions. For asset return forecasting, regression models incorporated macroeconomic factors and regime probabilities to predict 2025 asset performance. Finally, historical backtesting validated the model’s effectiveness in capturing major market trends while identifying potential limitations, ensuring robustness in real-world applications.
Optimal Clusters for Market Regimes
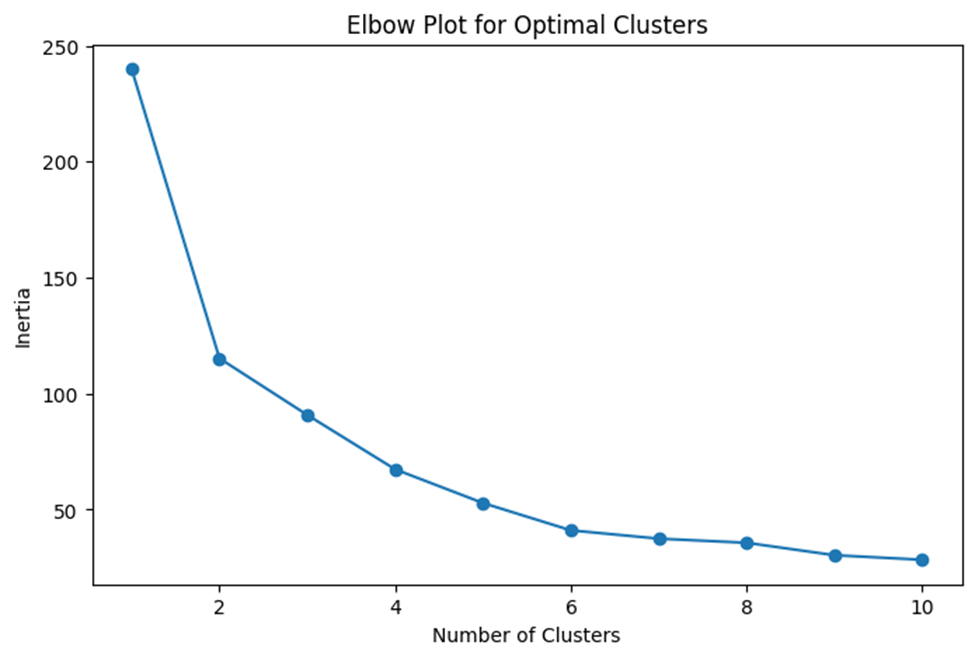
The elbow method was used to determine the optimal number of clusters (market regimes) by plotting the clustering inertia against different values of k. The chosen point is where the graph bends like an elbow, indicating that adding more clusters beyond this point does not significantly improve the fit. In practice, this means selecting the smallest number of clusters that still captures most of the variance in the data. In our analysis, the elbow occurred at k = 2, which was adopted as the number of distinct market regimes. This approach strikes a balance between detail and simplicity—ensuring that we capture distinct market regimes without overfitting to noise.
As a result, the market was segmented into two persistent conditions, each representing a cluster of similar macro-financial environments. This implies that historically, the market tends to operate in two distinct regimes:
- Bullish Regime: Characterized by economic expansion, stable inflation, accommodative monetary policy, and risk-on sentiment.
- Bearish Regime: Associated with economic contraction, high inflation, tightening monetary policy, and risk-off behavior.
Recognizing these clusters helps classify market conditions and prepare investment strategies aligned with prevailing trends.
Market Regimes with Current Macroeconomic Indicators Overlay
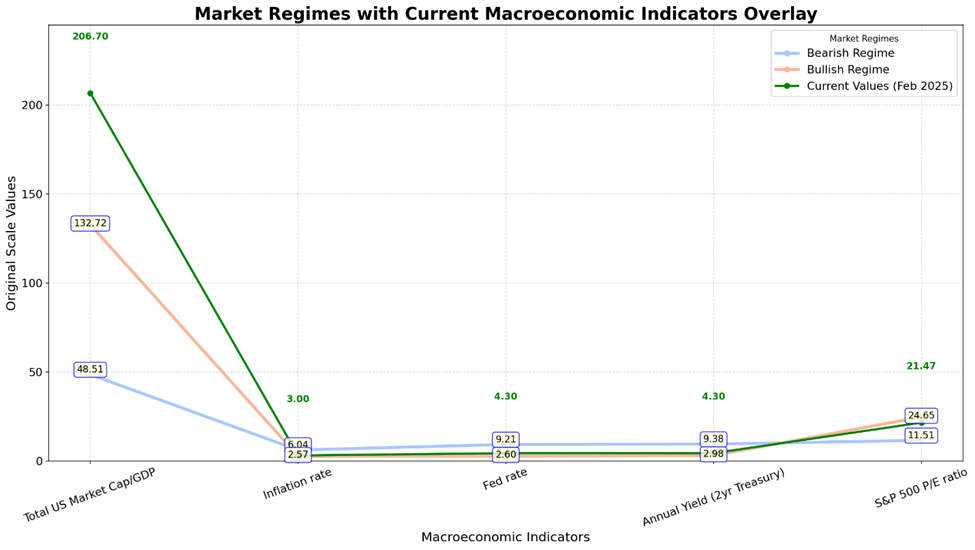
- Total US Market Cap/GDP is at 206.70, significantly higher than previous bullish (132.72) and bearish (48.51) regime levels, suggesting market overvaluation and a potential correction risk.
- Inflation Rate is at 3.00%, positioned between bullish (2.57%) and bearish (6.04%) levels, signaling moderating inflation pressures but still above target levels.
- Federal Funds Rate stands at 4.30%, closer to bullish (2.60%) than bearish (9.21%) levels, indicating monetary policy is restrictive but not at recessionary levels.
- Annual Yield (2-Year Treasury) is 4.30%, aligning more closely with past bullish levels (2.98%) than bearish (9.38%), reinforcing expectations of stable bond markets.
- S&P 500 P/E Ratio is 21.47, higher than the bearish average (11.51) but lower than the bullish average (24.65), indicating moderate optimism but stretched valuations.
The overlay of current macroeconomic indicators (as of February 2025) on historical regime clusters provides a clear view of how today’s market environment compares to past bullish and bearish periods. The data suggests that the market is at a crossroads, straddling both regimes rather than being fully committed to one. On the bearish side, Total US Market Cap/GDP (206.70) is significantly above both bullish (132.72) and bearish (48.51) historical levels, indicating overvaluation risks that could lead to a correction. Inflation (3.00%), while lower than past bearish levels (6.04%), remains above the bullish regime average (2.57%), signaling that inflationary pressures persist. Additionally, the Federal Funds Rate (4.30%), although not as extreme as previous recessionary periods (9.21%), is still above bullish regime levels (2.60%), reflecting a restrictive monetary environment that may dampen growth.
On the bullish side, the S&P 500 P/E ratio (21.47%) sits between bullish (24.65%) and bearish (11.51%) levels, suggesting that valuation sentiment remains optimistic but not excessively high. The 2-Year Treasury Yield (4.30%) is closer to historical bullish levels (2.98%) than bearish levels (9.38%), reinforcing expectations that interest rates are stabilizing rather than continuing a tightening cycle. Inflation, though still elevated, is showing signs of moderation, which could provide room for a more accommodative monetary stance if the trend continues.
Overall, the market appears to be in a late-cycle phase, balancing between bullish optimism and bearish caution. If inflation continues to ease and monetary policy shifts toward rate cuts, markets could gravitate toward a bullish regime. Conversely, if economic pressures intensify—such as persistent inflation, further Fed tightening, or weakening corporate earnings—the market could tip into a bearish phase similar to past recessions. This inflection point highlights the need for vigilant macroeconomic monitoring and flexible investment strategies to navigate potential shifts in market conditions.
S&P 500 and Gold Returns (1995-2025) highlights the historical relationship between S&P 500 performance and gold returns:

- Gold exhibits an inverse correlation with equities, performing strongly during periods of equity downturns, reinforcing its safe-haven role.
- Equity market cycles align with identified bullish and bearish regimes, confirming the validity of the model in classifying market conditions.
Historically, gold tends to outperform in bearish regimes, aligning with expectations that if macroeconomic conditions deteriorate, capital may flow into defensive assets. Conversely, equity returns follow economic expansions, benefiting from accommodative policies and strong corporate earnings.
Key Indicators Driving Regime Classification
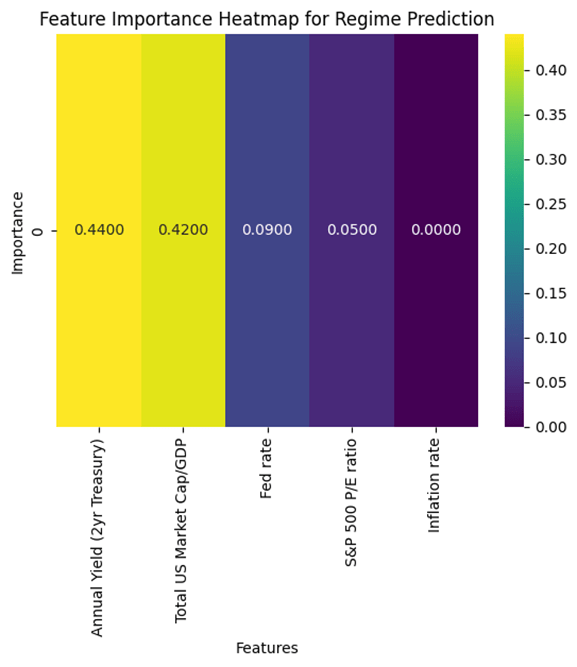
This figure illustrates the most influential macroeconomic indicators in determining market regimes:
- Annual Yield (2-Year Treasury): 0.44 – The strongest determinant of market regime, reflecting central bank policy expectations.
- Total US Market Cap/GDP: 0.42 – A critical valuation metric indicating overvaluation risks.
- Federal Funds Rate: 0.09 – A driver of liquidity conditions and credit availability.
- S&P 500 P/E Ratio: 0.05 – A measure of risk appetite and earnings expectations.
These findings confirm that interest rates and equity valuations are the dominant drivers of market regimes, aligning with traditional economic cycle theory.
Model Performance for Various Assets (2016-2024)
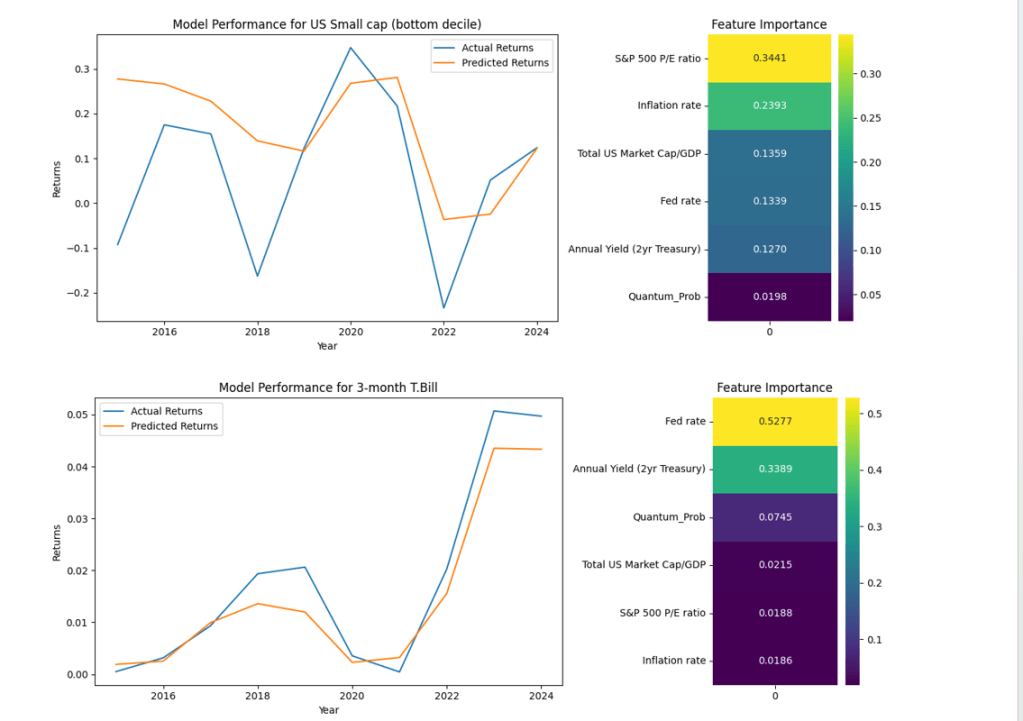
This figure presents a historical backtest comparing predicted returns versus actual market returns for different asset classes, including equities and fixed income. Each subplot illustrates how well the model aligned with actual return trajectories, demonstrating strong trend recognition while also revealing areas where prediction gaps occurred.
U.S. Small Cap equities exhibited a strong correlation between predicted and actual returns, reinforcing the model’s ability to track market sentiment shifts. Small-cap stocks historically perform well in risk-on environments, and the model correctly adjusted its forecasts to reflect these patterns. However, there were notable divergences in certain periods, as shown in the graph, where macroeconomic shocks may have disrupted predictive accuracy.
For 3-Month Treasury Bills, the model performed well in capturing the gradual rise in returns, particularly in response to interest rate policy adjustments. The feature importance analysis confirms that the Federal Reserve rate (0.5277) and 2-Year Treasury yield (0.3389) were the primary drivers influencing Treasury bill performance. These findings indicate that short-term fixed income returns are highly sensitive to monetary policy changes, reinforcing the model’s validity in rate-sensitive assets.
Despite its strengths, the model does have limitations. Sudden market dislocations, such as sharp sell-offs or unforeseen geopolitical events, can cause temporary prediction errors where the model struggles to react to fast-moving external shocks. This aligns with the known challenge that macroeconomic indicators are inherently lagging, meaning the model may recognize shifts after they occur rather than in real-time. Additionally, assets with high idiosyncratic risk (e.g., commodities affected by supply shocks or sector-specific equities) may diverge from regime-based predictions due to external, non-macro factors, as shown below.

Predicted Asset Returns for 2025
(*reported in decimals – 0.40: 40%)
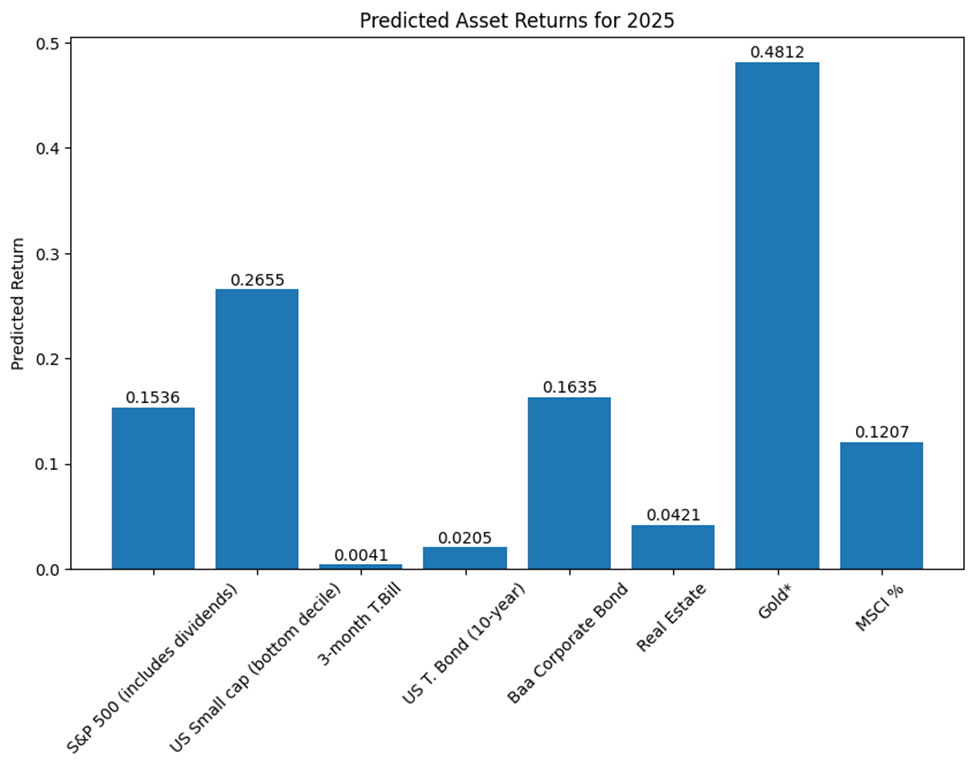
This figure provides an outlook for different asset classes:
- Gold (0.4812) – Expected to outperform, reflecting its role as a hedge in uncertain environments.
- US Small Cap (0.2655) – High return potential due to risk-on sentiment despite macro uncertainty.
- S&P 500 (0.1536) – Expected to generate moderate gains, aligning with a late-cycle market phase.
- Real Estate (0.0421) – Weak returns due to high interest rate impacts on valuations.
- US 10-Year Treasury Bond (0.0205) – Positive but minimal returns amid yield curve flattening.
- 3-Month T-Bill (0.0041) – Lowest return but remains a risk-free benchmark.
These projections align with cautious optimism, where equities and alternative assets show moderate upside, while bonds and real estate remain constrained by interest rate conditions.
Conclusion
The 2025 market outlook is shaped by a late-cycle transition between bullish and bearish conditions. Key takeaways:
- Interest rates and valuations are the most influential regime drivers.
- Gold and small-cap stocks are positioned for strong returns.
- Bonds offer positive but limited upside due to persistent inflation risks.
- Historical analogues validate a cautious but opportunistic investment approach.
